Screen details
Overview
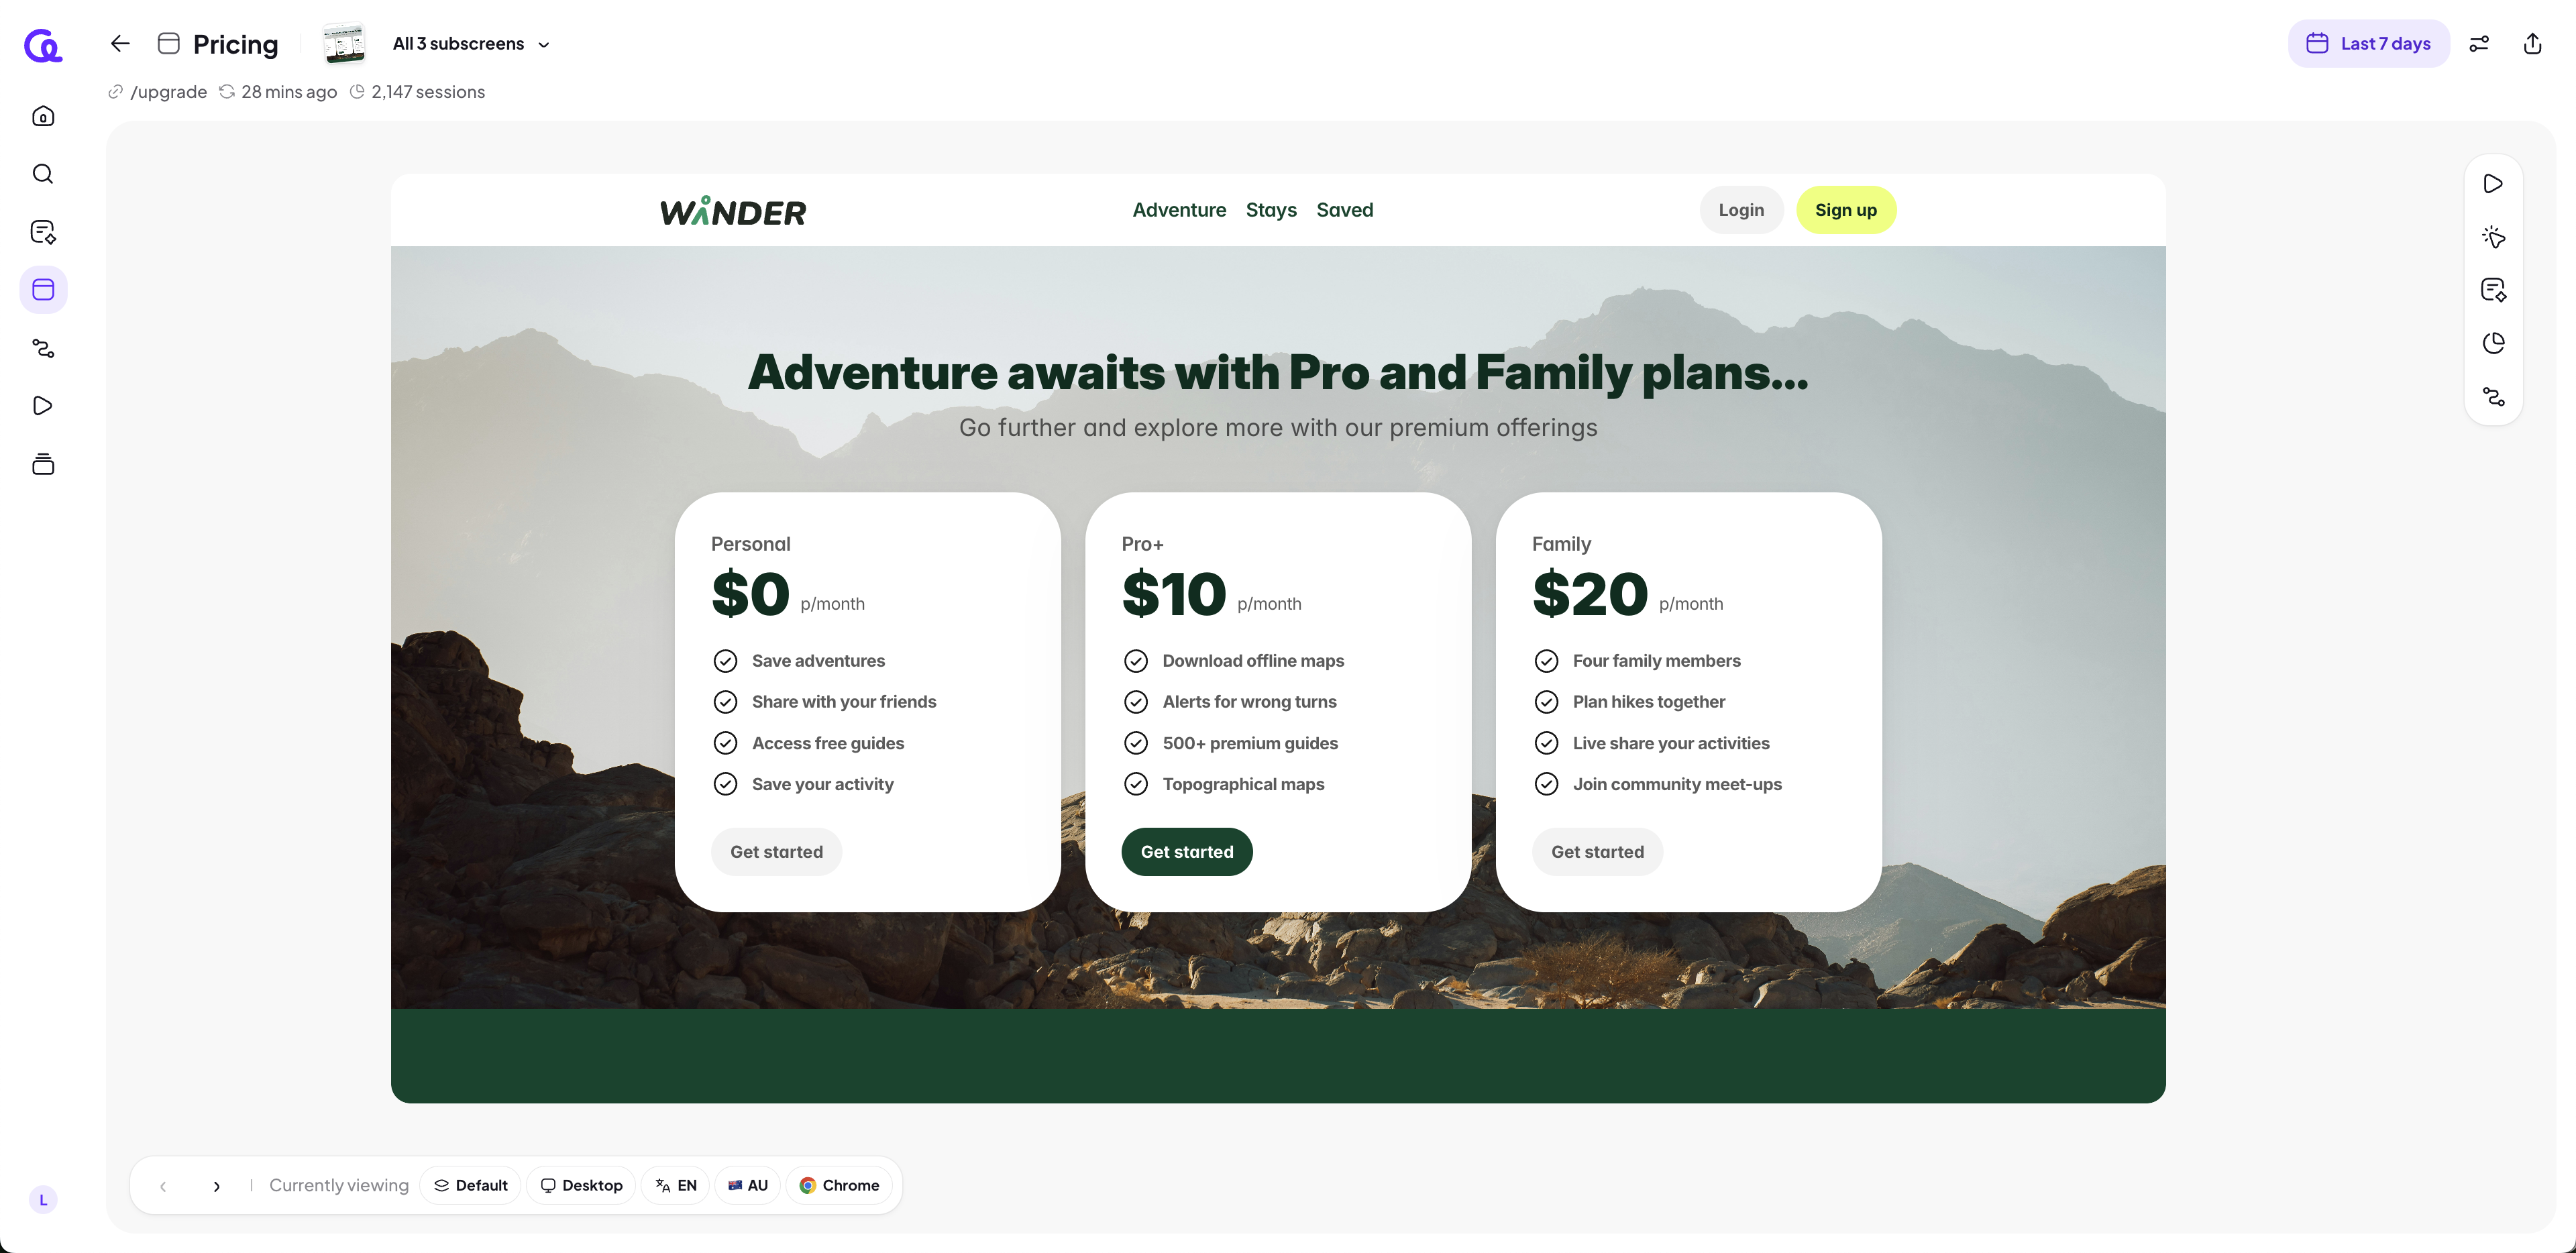
Each Screen page shows a visual snapshot of your product and key information about how users interact with it. This article explains every part of the Screen layout, including screen data, actions, filters, insights, and analytics.
Screen Header
The top of the page shows important details about the screen.
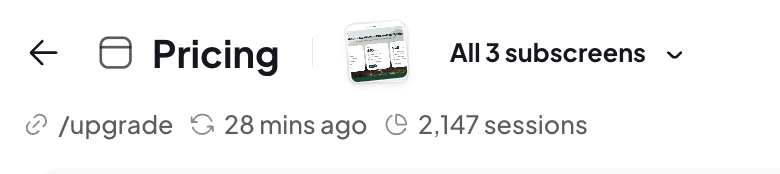
Screen Name
The name given to the screen.
You can edit the screen name by clicking the title.
Changes apply to the entire workspace so all teammates see the same name.
Last synced
Indicates when the screen was last synced to Adora.
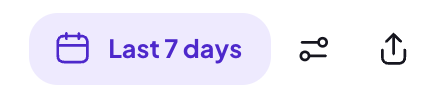
Session Count
Displays the number of sessions that included this screen.
The default time period is 7 days.
You can change the time filter to see data for different periods.
URL
Shows the URL where this screen was captured.
Subscreens carousel
Clicking the Default dropdown shows all the different variations of this screen. Selecting one of them will change the snapshot.
Learn more: Working with subscreens
Screen toolbar
The bottom of the screen gives more details about this screenshot.
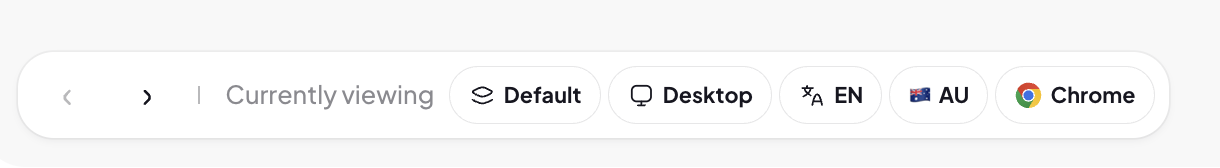
Arrows
You can click the arrows to view different screenshots. You can also use your keyboard arrow keys left and right.
Currently viewing
Which screen or subscreen you are viewing
Properties
Adora's default properties and any custom properties that you have will show as pills. You can:
Click on one of the pills, which will apply it as a filter
Hover over the pill to see the value, as well as copy the value to your clipboard
Properties
You can filter the screen by specific audience segments.
Filtering updates:
The session count
Actions
Insights
Analytics
Session list
Learn more: Using properties for screens
Screen snapshot
This is the visual capture of what the user saw.
You can scroll up and down, as the screen always renders in full-height.
Action clickmap
When viewing the snapshot, you can click on the screen and see the actions on the screen pulsing green, highlighting all interactive elements users clicked on this screen.
You can:
Click the screen to show the highlighted actions.
Hover over each action to see metrics on clicks, sessions, and users.
Side panel
Sessions
The Sessions tab gives you a list of session replays involving this screen. You can click on a session to open the session player.
Actions tab
The Actions tab shows a breakdown of all the interactive elements users clicked on this screen.
You can:
Review the full list of clickable items.
See where users interact most.
Insights
Insights highlight notable patterns for this screen.
Examples include:
Unusual drop-off
High bounce behavior
Repeated patterns across groups of users
Learn more: Insights in Adora
Analytics
Analytics provide lightweight metrics to help you understand performance.
This may include:
How many users reached this screen
How often they moved forward or backward
Funnel-style patterns related to the screen
Journeys
This provides a list of journeys where this screen is being used.